Why Your New SSD Drops to 45MB/s Halfway Through Copying a Large File: 200GB Continuous Write Benchmark (TLC vs. QLC)
Have you ever bought a budget 1 TB NVMe SSD advertising 3,500 MB/s, verified it with a quick 1 GB benchmark, and then watched in horror two months later as copying an 80 GB folder of family videos crashes from 2,500 MB/s down to 42 MB/s—slower than a 15-year-old 5400 RPM spinning hard drive?
To expose the “Synthetic Benchmark Illusion,” we took two 1 TB NVMe SSDs—both rated at 3,500 MB/s—filled them to 50% capacity (simulating real daily use), and ran a continuous 200 GB raw write benchmark:
- Drive A: Budget QLC NAND (4 bits/cell, 16 voltage states) with dynamic SLC caching;
- Drive B: Mainstream TLC NAND (3 bits/cell, 8 voltage states).
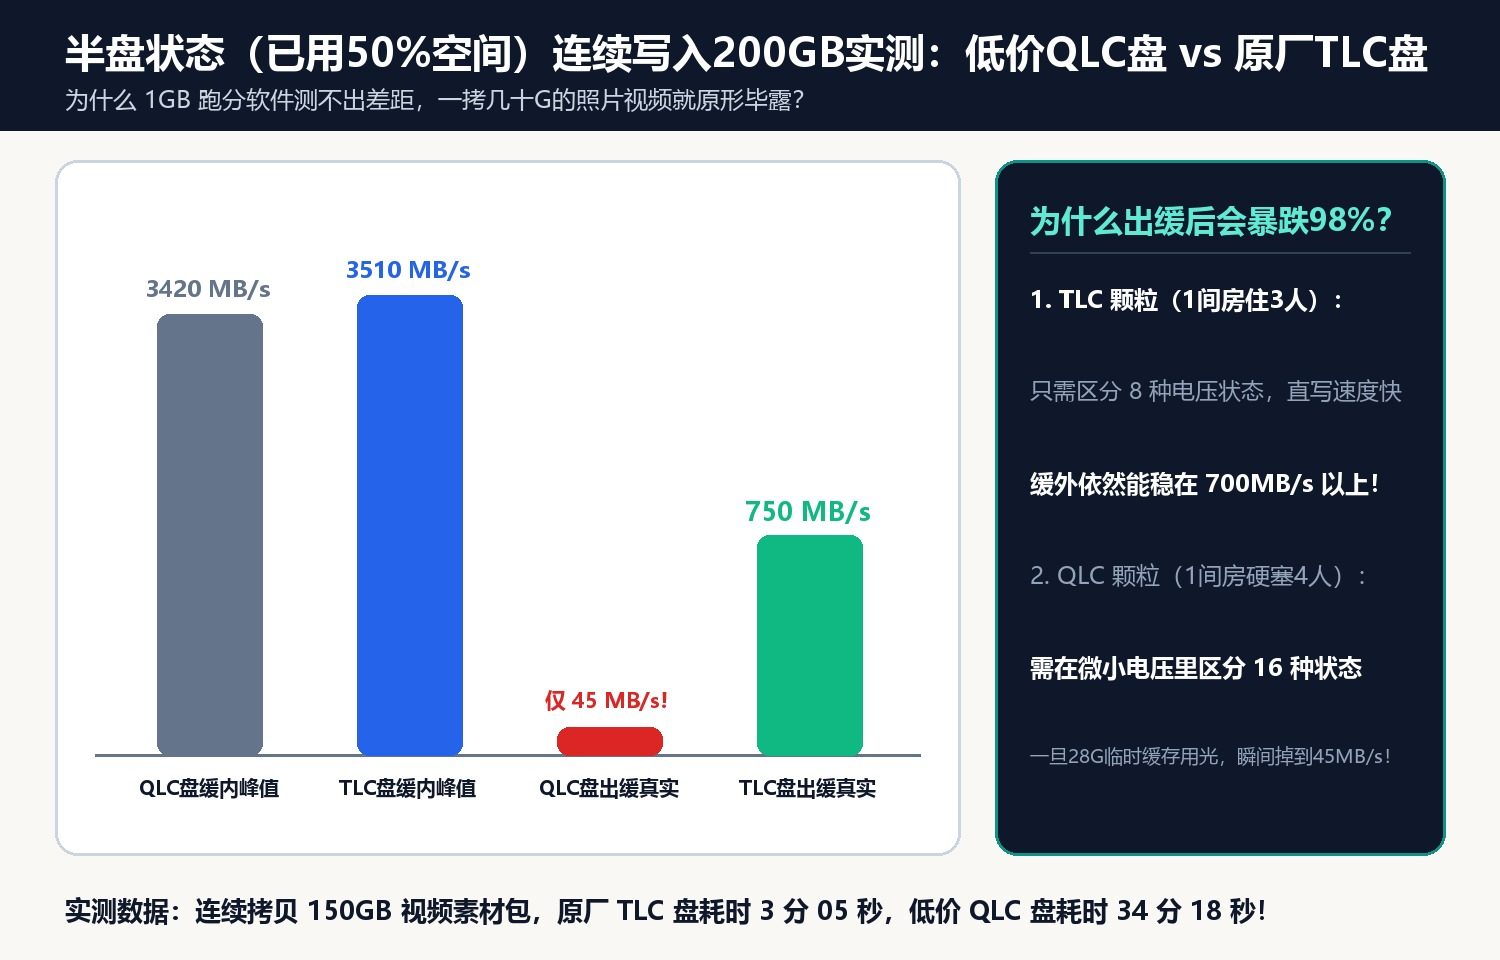
1. The Pseudo-SLC Cache Cliff: 3,420 MB/s to 45 MB/s
While Drive A maintains 3,420 MB/s inside its 28 GB pseudo-SLC cache buffer, the moment continuous writes exceed 28 GB, the controller must fold 1-bit cells into 16-state QLC cells on the fly—collapsing sustained write speeds to 45–65 MB/s. Meanwhile, the native TLC drive (Drive B) sustains 680–850 MB/s after its 110 GB cache buffer—finishing a 150 GB transfer in 3 minutes vs. 34 minutes.

2. How to Inspect True NAND Flash Particles in 10 Seconds Without Peeling the Sticker
Never peel off the warranty sticker to check NAND markings. Instead:
- Run
CrystalDiskInfoto verifyPower On Count <= 5andHost Writes = 0 GB. - Run Vlo’s
Flash IDutility (maxio_nvme_fid/phison_nvme_flash_id/smi_nvme_flash_id) to query the controller’s hardware registers directly, revealing the exact manufacturer, layer count, andTLCvs.QLCcell architecture on every channel.
Discussion